Software Downloads
Aim Software solutions are developed to allow you to download data from your Aim products for the purpose of data analysis to improve your performance. Get more data; win more races.
View and download our software options below to start configuring your device or to update your firmware version. Don't forget to take a look at our Aim Academy training videos to learn more about how you can use Race Studio to your advantage.
Download the Race Studio 3 App
Take RS3 with you. Get the app on iPhone or Android.


Race Studio Software
| Software | Download |
|---|---|
| Race Studio 3 | Download User Manual |
| BETA Race Studio 3 | Download User Manual |
| Race Studio 2 | Download |
Vendor:AiM Accessories
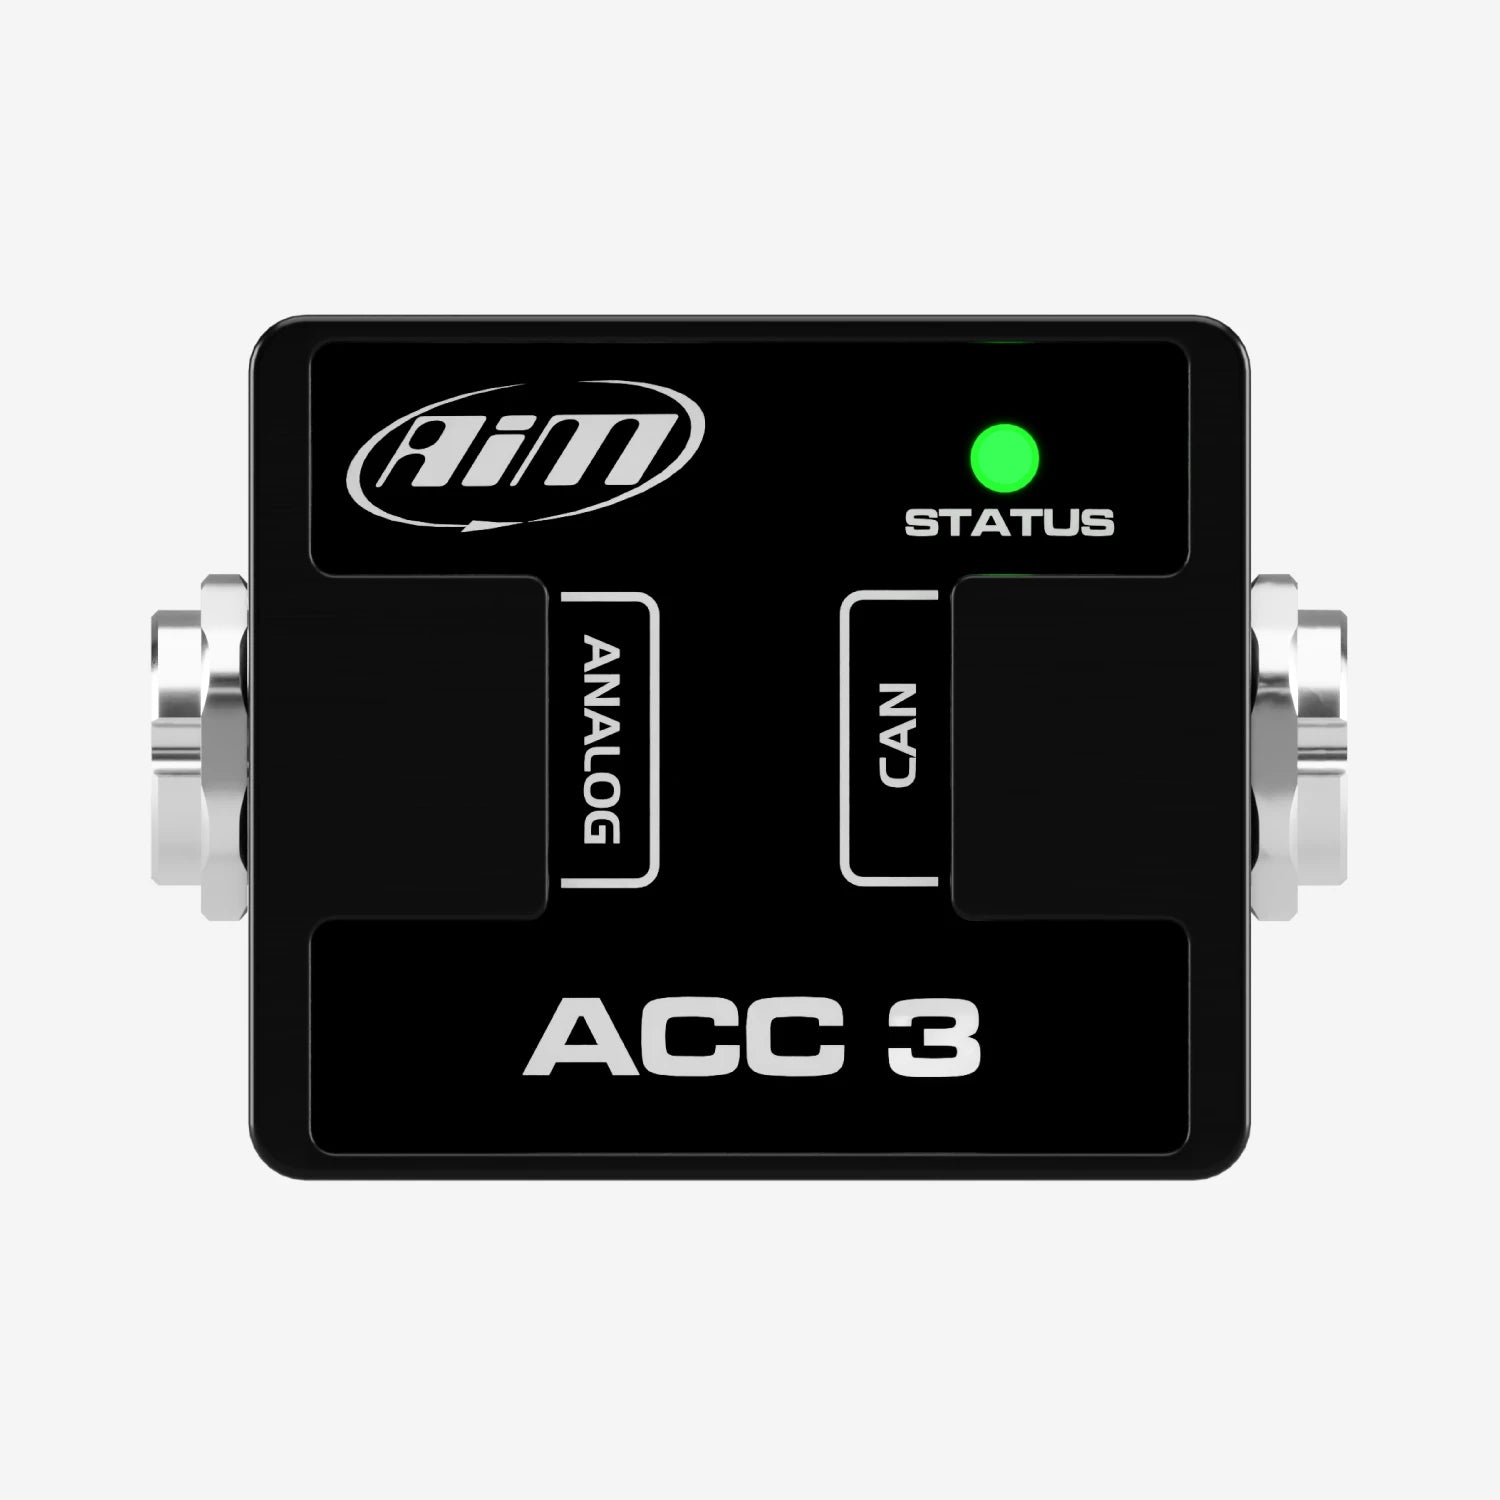
Aim ACC3 Analogue CAN Converter
£257.00
CAN & Analogue Data Input
2 Speed Inputs
Compact & Lightweight
Water Resistant


Vendor:LiveU
Live Streaming Device
Up To 20Mbps Streaming
Designed for Creators
Stream Camera Footage